Data is a critical component of the Anchor Community Initiative. Our Data & Evaluation Director, Liz, explains what data communities are collecting and how it will help communities end youth and young adult homelessness and achieve equitable outcomes.
Ending youth and young adult homelessness requires accurate data that tells communities how many young people are experiencing homelessness in real-time, who these young people are, and what their needs are. To achieve this, Anchor Communities have established By-Name Lists and monitor monthly data points that reflect the number of unaccompanied youth and young adults entering and exiting their homeless system.
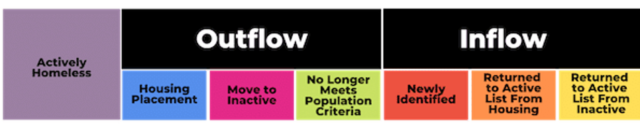
The Anchor Community Initiative draws inspiration from the Built for Zero model by Community Solutions, which has been effective in ending veteran and chronic homelessness in communities around the nation. To follow this model, communities need to look beyond the performance of projects and programs, and towards the performance of the entire homeless system. This means that each month, communities collect three types of data points:
- Actively homeless: This encompasses ALL unaccompanied youth and young adults experiencing homelessness each month. It includes young people who are unsheltered, sheltered and couch-surfing.
- Outflow: This is the number of young people who exit the system each month. It includes young people who have been housed, young people who providers have not been able to reach in 90 days, and people who have aged out.
- Inflow: This is the number of young people who enter the system each month, either because they are new to the system or returning to homelessness.
 Young people who experience homelessness are individuals with unique identities. Furthermore, young people of color and LGBTQ+ young people experience homelessness at higher rates than their white, cisgender, heterosexual peers. To reflect our commitment to racial and LGBTQ+ equity, we want our data to show young people’s unique identities and shine a light on disparities. We’re pushing our data work further, and we’ve updated our data infrastructure so communities can now submit race/ethnicity, gender identity, sexual orientation, and age data. Anchor Communities have access to data dashboards showing these data points and other analytics thanks to software provided by the Tableau Foundation.
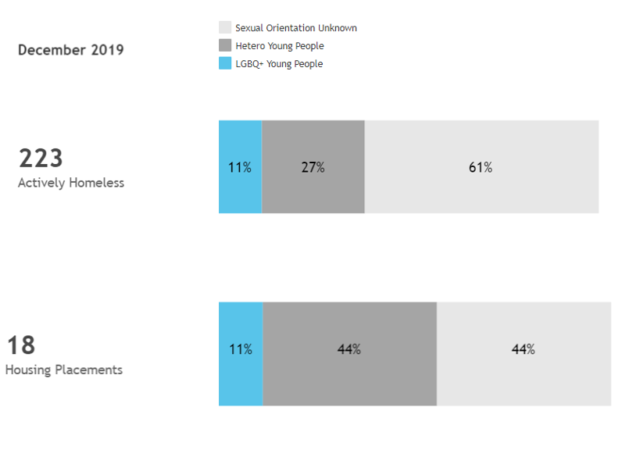
Demographic data allows Anchor Communities to further interrogate system performance and set goals around equitable outcomes for young people of color and LGBTQ+ young people. For example, in the data dashboard below we see that in this community, at least 11% of the young people experiencing homelessness in December 2019 are lesbian, gay, bisexual, or queer. However, the sexual orientation of over 60% of young people experiencing homelessness in this community is “unknown.” Being able to see this “unknown” percentage prompts communities and our coaching team to delve deeper into what might be happening on the ground, why these data are missing, and what improvement projects could be implemented to improve data quality.
 In order to provide supportive and responsive services and housing for young people, communities must first understand what the needs are. Data provides a foundation for communities to plan and advocate for resources to support young people.
This updated data infrastructure is the first (of many) steps that we will take to achieve more equitable outcomes. The new dashboard allows us to measure improvements and reductions in youth and young adult homelessness as communities are working to make system level changes. Thank you to everyone in the Anchor Communities who works hard to submit monthly data points!
Leave a Reply